What do you expect will happen? We usually think in simple terms: better or worse? Up or down? An advert for Mad Money on CNBC advises:
Make $ as bull or bear—but don’t be a hog!
How we talk about the markets matters a great deal. Stories influence our expectations and our sentiments. The narratives around the Black-Scholes model and the Gaussian copula were once widespread and affected the way we thought about risks and risk dependencies. Now these narratives are out of currency, along with many others.
New stories have taken hold: unicorns and the digitalization of the world, for example.The robots are coming to Wall Street. How influential will they become as storytellers?
Markets unravel when the stories get too tall and reality catches up with fantasy. Now it’s an interesting question to ask: when are markets vulnerable and when are they robust to irrationally exuberant conventional wisdom?
From a psychological point of view, we become more robust as we become more aware of ourselves and our environment. The ability to describe our situation rationally protects us from exaggeration and hysteria.
By extension, one could posit that markets are robust when market participants and pundits are able to speak about their expectations intelligently. Why must I be a bull or a bear, why won’t you let me be a hog?
We like to fit observed events into patterns that we know. As Robert Shiller writes:
There are many aspects to intuitive probability. One of them is the representativeness heuristic, identified originally by Tversky and Kahneman (1974). They showed that in forming subjective judgments, people have a tendency to disregard base rate probabilities, and to make judgments solely in terms of observed similarities to familiar patterns. We can expect the same representativeness heuristic to encourage people to see patterns in stock market price changes, simple patterns like a bull market or a bear market, even though such sequences of same-sign price changes are actually quite rare.
Shiller, Robert. Bubbles, Human Judgement, and Expert Opinion, Cowles Foundation Discussion Paper No. 1303, 2004.
The bull/bear dichotomy is a lazy representation of sentiment. It is also dangerous. Binary classification invites crisis. Is anything ever black or white, good or evil, friend or foe, bull or bear? What are the shades of grey in between? How can we describe these shades at a conversational level without running the risk of entangling ourselves in complication?
Prices from Expectations
Prices can go up and down or stay the same. But how and why do we become bulls or bears (or hogs)? Are we bullish because we think the likelihood of great gains has increased, or because we think downside risk has lessened, or could it be a bit of both? Do all these attitudes belong to the same kind of bull?
Prices are determined by our expectations for the future (exactly how and to what extent is a matter of a debate among experts that we will not let ourselves be distracted by). But how can we get a grip on our expectations? Is there a simple tool we can use to take a stab at what we think is going to happen?
In fact, expectations can be expressed very intuitively in terms of price curves for calls and puts. If you’re feeling optimistic you may attach a higher value to call options than the market. A perceived risk of sudden mayhem should make you bullish for puts.*
These are just two examples. We will see shortly that there are eight fundamental call/put movements to think about. Each movement corresponds to a description of market conditions. There are three ways of being a bull, three ways of being a bear and two ways of sitting on the fence.
We typically think of call and put options as derivatives of the fundamental asset price. In our set-up, however, let’s suppose that calls and puts are liquidly traded and that the asset price is derivative to our expectations. More specifically, let’s suppose that constant term (30-day) calls and puts are liquidly traded for all strikes. (Constant horizon means that the price of these instruments is constantly updated to reflect market expectations for the stock over 30-days.)
Let’s make two assumptions so that we can focus on the basic idea: let’s say that interest rates are zero (they are anyway) and that the asset behind the scenes pays no dividends.
A well-known example of a constant horizon instrument is the VIX index, which indicates the volatility implied by call/put options with a 30-day expiry. The VIX is calculated by interpolating between near term option prices, which have an expiry date less than 30 days in the future, and next term option prices, which have an expiry date that is more than 30-days hence.
As long as call and put options are traded for a good range of strikes for near-term and next-term expiries around 30-days from now then we can interpolate in time and across strikes to estimate the full range of constant term call and put prices.
Denote the constant-term call and put prices for a strike K by C(K) and P(K) respectively. As long as put-call parity holds C(K)-P(K)=S-K, where S is the current asset price. What this simple equation tells us is that asset prices are determined call and put prices. The current asset price is the value of K for which C(K)=P(K).
Market Conditions
Most market commentary is focused on asset prices. In our set-up, because of put-call parity, the asset price is a trivial derivative of the constant term options: it’s simply given by the point where call and put prices intersect.
Excursion into Fear
Before getting into the eight market conditions that can be derived from put/call price movement, let’s briefly review the relationship between call/put options and the VIX index. Because we are setting our constant term to be 30 days we can link expectations directly with expected movements in the VIX.
The relationship between the VIX and call/put options is given by

where C is a positive constant.
This relationship tells us how our expectations for changes in market conditions (expressed through expected movements in P and C) relate to corresponding expected changes in the VIX.
For example, suppose we think that the curve of put prices will steepen. Then we should expect a significant spike in the VIX. The reason is that puts are affected less by the 1/K^2 weighting in the left half of the curved triangle (see picture below) . In contrast, if we expect put prices to remain steady but call prices to rise, then we are unlikely to see large movement in the VIX, since the 1/K^2 term kicks in more strongly.
Ways of being (a bull or a bear)
The best way of examining your expectations is by drawing a picture of calls and puts like this.

Figure: A Blank Canvas for Expectation Management
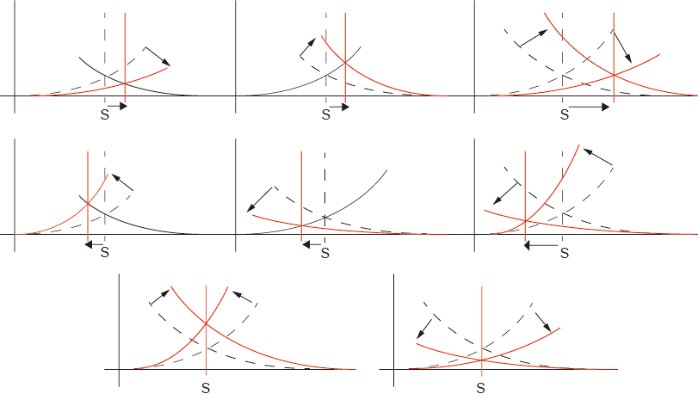
Now, what do you expect will happen? For example, do you think large gains are becoming more likely and drops less likely? Then pencil in the shape of a new call price surface moving upwards from where it is now and a new put price surface moving downwards (see top right corner in picture below). Thinking about all the simple combinations, we arrive at the following eight pictures. (It’s important to point out that these are stylized sketches. You should really ignore the call prices to the left of the vertical line and the put prices to the right of the vertical line. Everything is determined by the curved triangle in the middle.)
 Figure: Filling in the Expectation Canvas
In the top row we have three ways of being bullish. Let’s give them names. First, a jaded bull is optimistic only because it (let’s be neutral) thinks the risk of falling has decreased. A reluctant bull thinks that the chances of gains have increased, but won’t change its assessment of the downside risks for now. Finally, a raging bull is optimistic about future gains and less afraid of a fall.
Next we have three ways of being bearish. First, a reluctant bear is pessimistic only because it thinks the risk of falling has increased, it won’t adjust it’s hopes for upside gains just yet. A jaded bear has lost confidence. It believes a bit less in a brighter future but doesn’t think life will get much worse. Finally, a raging bear thinks the world is getting worse and there’s less hope of redemption.
Finally, there are two ways of being indecisive. The deer is hyper-nervous but indecisive. To be deerish is to see a threat but be frozen in the headlights. You just can’t decide what is going to happen. Expected volatility is higher, calls and puts rise, but you don’t see a new trend. On the other end of the personality spectrum, the owl is sangfroid. To be owlish is to believe that the future will be much like the present. In an owlish market volatility is down, everything is under control.
These eight ways of being are summarized in the following table, including an indication of the corresponding movements in the VIX. These indications are very rough and ready. The actual reaction of the VIX to changes in calls and puts would depend on the relative magnitude of movements and the original slopes of the curves. As a rule of thumb, changes in expectation on downside risk have a much larger effect than changes in expectations on upside risk due to the 1/K^2 weighting in the formula for the value of the VIX shown earlier.

From Boom to Bust
So how would these behaviours line up during a market craze?
It’s as easy to talk about bubbles forming and popping as it is to talk about bulls and bears. Can we improve the quality of that conversation a bit?
The term “bubble” is widely used but rarely clearly defined. We believe that in its widespread use the term refers to a situation in which excessive public expectations of future price increases cause prices to be temporarily elevated.
Case, Karl E. and Shiller, Robert J. Is there a Bubble in the Housing Market?, Brookings Papers on Economic Activity, 2, 2003.
There’s no way to spot a bubble for certain but there are warning signs that can be picked up by looking at the VIX and stock price movements together. Let’s go through a boom-bust cycle in terms of puts and calls and our expectation canvas.
Improved sentiment can mean: less pessimism or more optimism. The greatest price increases occur when these re-evaluations occur jointly.
For clues about what is going on we can look at how the VIX is moving. If the VIX is rising as the stock price is rising then the market is reluctantly bullish: expectations for future gains are up, but downside risk is seen to be unchanged. If the VIX goes down as the price rises, then this suggests reduced pessimism. If the stock is rising significantly as the VIX falls then we’re in ragin’ bull territory.
As the VIX falls and the stock rises, you may like to pull out the expectation canvas and check your own beliefs against market activity.
By the time the rise in prices has lost momentum and the VIX is shooting up the market is on a knife-edge. The market is deerish. Something is up, but no-one can decide which way it will go. The market is frozen in the headlights. All options are on the table: prices might rocket or crash over the next period. You should make up your mind or get out before it’s too late. Don’t be a hog!
If the VIX begins to rise as the stock falls, that means the market has turned reluctantly bearish. People aren’t ready to adjust their expectations for future gains, but are beginning to factor in more risk.
If the VIX drops with the stock price then the bears are simply jaded. The hype has lost its lustre, but there’s no reason to panic.
A panic is simple to spot: the VIX explodes and the price drops. Raging bears drive up the price of puts but won’t touch a call.
When things settle down it is the time of the owls. In an owlish market, expectations adjust slowly and the markets are calm. The VIX is at rock-bottom.
You, however, should be planning for the next cycle!
* Puts and calls can be seen to express our expectations for the future because knowing their prices is equivalent to knowing the expected distribution of the asset price at expiry time. Breeden, Douglas and Litzenberger, Robert, Prices of State-Contingent Claims Implicit in Option Prices, Journal of Business, 1978, Vol. 51, No. 4, 621–651.
